Researchers with the Honeynet Project have created a graphic user interface (GUI) that plots a wide variety of data and give a visual representation that can make it easier to detect attacks.
The new GUI is part of the open-source Picviz tool. The developers say the graphic display is rendered from “traffic logs, database logs, SSH logs, syslogs, IPtables logs, Apache logs, and other sources.”
Picviz is described in a Nov. 25 paper “Know your tools: use Picviz to find attacks” by Sebastien Tricaud of The Honeynet Project and Victor Amaducci of the University of Campinas (Unicamp) (paper here.)
Picviz available here.
Here is a Picviz graphic rendering of traffic indicating an OpenVPN session.
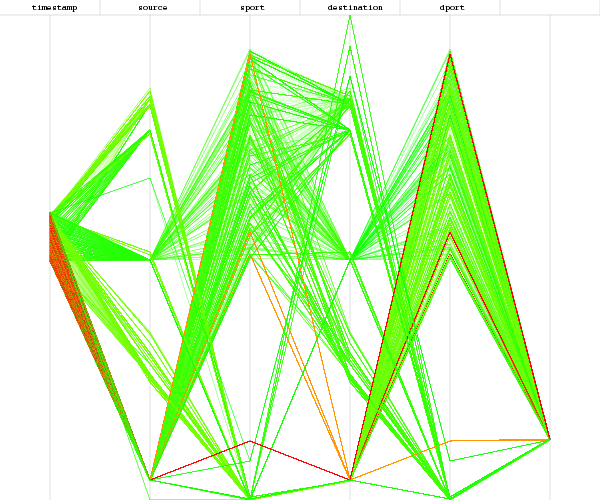
The red displays the line of the VPN session (data taken from tcpdump.)
(More info on wallinfire site here.)
Story here.
Tom Kelchner